
Immuno-genomic atlas for
immune checkpoint blockade-based
cancer immunotherapy

Cancer-Immu is an open-access resource for exploring associations between onco-immunological genomic data and immunophenotype and thus reveals some important biological conclusions with implications for ICB-based immunotherapy. The Cancer-Immu currently contains 4,035 samples with both ICB response outcome and genomic profiling by either bulk sequencing or single-cell technologies. Each genomic profiling provides multiple types of features, including the known or novel signatures predictive of immunotherapy response. Genetic level is comprised of mutation, mutational loads/burden and mutational signature. Transcriptomic level includes expression, expression sum, expression relation pairs and immune cell components. Single-cell level provides gene/protein expression and specific cell population. Cancer-Immu provides meta-analysis and pan-cancer analysis modules for signature prioritization and specific signature assessment. Meta-analysis reveals consistent signatures across multiple study cohorts, while pan-cancer analysis enhances our ability to detect and analyze rare features by aggregating events across cohorts/tumor types.
News!
08-22-2023, New added data:
--73 samples from 1 study, Pan-cancer analysis of advanced patient tumors reveals interactions between therapy and genomic landscapes.
08-18-2023, New added data:
--218 samples from 1 study, Collaborative study from the Bladder Cancer Advocacy Network for the genomic analysis of metastatic urothelial cancer.
07-20-2022, New added data:
--28 samples from 1 study, A high OXPHOS CD8 T cell subset is predictive of immunotherapy resistance in melanoma patients.
06-19-2021, New added data:
--144 samples from 1 study, Integrative molecular and clinical modeling of clinical outcomes to PD1 blockade in patients with metastatic melanoma.
03-07-2021, New added data:
--31 samples from 1 study, PD-1 Blockade in Tumors with Mismatch-Repair Deficiency.
02-02-2021, New added data:
--348 samples from 1 study, TGFb attenuates tumour response to PD-L1 blockade by contributing to exclusion of T cells.
--29 samples from 1 study, Neoadjuvant anti-PD-1 immunotherapy promotes a survival benefit with intratumoral and systemic immune responses in recurrent glioblastoma.
11-06-2020, New added data:
--15 samples from 1 study, Clonal replacement of tumor-specific T cells following PD-1 blockade.
10-25-2020, New added data:
--112 samples from 1 study, A Cancer Cell Program Promotes T Cell Exclusion and Resistance to Checkpoint Blockade.
16 cancer types

4,035 samples

5 drugs

Bulk sequencing and single-cell technologies

Select datasets to explore (click rows in the table below)
@Vanderbilt University Medical Center
Center for Quantitative Sciences
497A Preston Research Building | Nashville, TN 37232 | 615-322-6618
Signatures prioritization
Signatures prioritization in the meta-analysis is aimed to rank signatures based on their common associations with immunotherapy response across multiple cohorts. The association test is performed in each individual cohort, Effect size and p-values were generated from random effect model of meta-analysis and the signatures are ranked by the p-values. It prioritizes four types of features, mutations, mutational signatures, gene expression and immune cell components, which ranks all genes in features of mutations and expression, 30 mutational signatures and 22 immune cell components.
Specific signature assessment
--Mutation
Specific signature assessment module provides a detailed view of one particular feature. The associations with immunotherapy response, overall survival (OS) and progression free survival (PFS) are investigated in the module.
Mutations: exploring the associations of mutational frequencies with immunotherapy response, OS and PFS.
Statistics
Number of selected cancer type:
Number of selected samples:
Clinical Attribute
Download
Data format:
Click row(s) in the table above to filter samples and
it, then click the 'GO' button on the left to re-analyze.
Query in TCGA data
Meta-analysis across selected cohorts
Analysis in each individual cohort
Meta-analysis across selected cohorts
Analysis in each individual cohort
Meta-analysis across selected cohorts
Analysis in each individual cohort
Summary of the selected feature
Specific signature assessment
--Mutational loads/burden
Specific signature assessment module provides a detailed view of one particular feature. The associations with immunotherapy response, overall survival (OS) and progression free survival (PFS) are investigated in the module.
Mutational loads/burden: exploring the associations of mutational loads/burden (TMB) with immunotherapy response, OS and PFS.
Statistics
Number of selected cancer type:
Number of selected samples:
Clinical Attribute
Download
Data format:
Click row(s) in the table above to filter samples and
it, then click the 'GO' button on the left to re-analyze.
Meta-analysis across selected cohorts
Analysis in each individual cohort
Meta-analysis across selected cohorts
Analysis in each individual cohort
Meta-analysis across selected cohorts
Analysis in each individual cohort
Summary of the selected feature
Specific signature assessment
--Mutational signatures
Specific signature assessment module provides a detailed view of one particular feature. The associations with immunotherapy response, overall survival (OS) and progression free survival (PFS) are investigated in the module.
Mutational signatures: exploring the associations of mutational signatures with immunotherapy response, OS and PFS. Mutational signatures were obtained using deconstructSigs package (v1.6.0) in R, which selects combinations of known mutational signatures that account for the observed mutational profile in each sample. Only somatic mutations in exome regions were considered, and trinucleotide counts were normalized by the number of times each trinucleotide context was observed in the exome region.
Statistics
Number of selected cancer type:
Number of selected samples:
Clinical Attribute
Download
Data format:
Click row(s) in the table above to filter samples and
it, then click the 'GO' button on the left to re-analyze.
Meta-analysis across selected cohorts
Analysis in each individual cohort
Meta-analysis across selected cohorts
Analysis in each individual cohort
Meta-analysis across selected cohorts
Analysis in each individual cohort
Summary of the selected feature
Specific signature assessment
--Expression
Specific signature assessment module provides a detailed view of one particular feature. The associations with immunotherapy response, overall survival (OS) and progression free survival (PFS) are investigated in the module.
Expression: exploring the associations of gene expression with immunotherapy response, OS and PFS.
Statistics
Number of selected cancer type:
Number of selected samples:
Meta-analysis across selected cohorts
Statistics
Number of selected cancer type:
Number of selected samples:
Clinical Attribute
Download
Data format:
Click row(s) in the table above to filter samples and
it, then click the 'GO' button on the left to re-analyze.
Query in TCGA data
Meta-analysis across selected cohorts
Analysis in each individual cohort
Meta-analysis across selected cohorts
Analysis in each individual cohort
Meta-analysis across selected cohorts
Analysis in each individual cohort
Summary of the selected feature
Specific signature assessment
--Expression sum
Specific signature assessment module provides a detailed view of one particular feature. The associations with immunotherapy response, overall survival (OS) and progression free survival (PFS) are investigated in the module.
Expression sum: exploring the associations of gene expression sum with immunotherapy response, OS and PFS. Expression sum focuses on a list of genes, which is a simplified concept to explore gene sets or pathways of interest. Please choose either pre-defined gene sets which were collected from ICB-stimulated mechanism or define your own gene set.
Statistics
Number of selected cancer type:
Number of selected samples:
Clinical Attribute
Download
Data format:
Click row(s) in the table above to filter samples and
it, then click the 'GO' button on the left to re-analyze.
Query in TCGA data
Meta-analysis across selected cohorts
Analysis in each individual cohort
Meta-analysis across selected cohorts
Analysis in each individual cohort
Meta-analysis across selected cohorts
Analysis in each individual cohort
Summary of the selected feature
Specific signature assessment
--Expression relation pairs
Specific signature assessment module provides a detailed view of one particular feature. The associations with immunotherapy response, overall survival (OS) and progression free survival (PFS) are investigated in the module.
Expression relation pairs: exploring the associations of gene pairs with immunotherapy response, OS and PFS. Gene expression relation pairs is a summed score of relative comparison of gene pairs.
Statistics
Number of selected cancer type:
Number of selected samples:
Clinical Attribute
Download
Data format:
Click row(s) in the table above to filter samples and
it, then click the 'GO' button on the left to re-analyze.
Meta-analysis across selected cohorts
Analysis in each individual cohort
Meta-analysis across selected cohorts
Analysis in each individual cohort
Meta-analysis across selected cohorts
Analysis in each individual cohort
Summary of the selected feature
Specific signature assessment
--Immune cell components
Specific signature assessment module provides a detailed view of one particular feature. The associations with immunotherapy response, overall survival (OS) and progression free survival (PFS) are investigated in the module.
Immune cell components: exploring the associations of immune cell proportion with immunotherapy response, OS and PFS. Immune cell components were generated from gene expression profiles by using CIBERSORT.Abundances of 22 immune cell types were estimated from mixed gene expression data. The values of immune cell components denote the cell type proportions.
Statistics
Number of selected cancer type:
Number of selected samples:
Meta-analysis across selected cohorts
Statistics
Number of selected cancer type:
Number of selected samples:
Clinical Attribute
Download
Data format:
Click row(s) in the table above to filter samples and
it, then click the 'GO' button on the left to re-analyze.
Meta-analysis across selected cohorts
Analysis in each individual cohort
Meta-analysis across selected cohorts
Analysis in each individual cohorte
Meta-analysis across selected cohorts
Analysis in each individual cohort
Summary of the selected feature
Specific signature assessment
--Integration
Specific signature assessment module provides a detailed view of one particular feature. The associations with immunotherapy response, overall survival (OS) and progression free survival (PFS) are investigated in the module.
Integration: exploring the associations of any two signatures with immunotherapy response, OS and PFS. The two combined signatures can be selected from either genetic and/or transcriptomic features. Samples will be split into X-high/Y-high, X-high/Y-low, X-low/Y-high, and X-low/Y-low groups based on two interactive sliders.
Statistics
Number of selected cancer type:
Number of selected samples:
Clinical Attribute
Analysis in each individual cohort
Combined p-value of the meta-analysis for selected cohorts:
, which is estimated from single p-values,
Analysis in each individual cohorte
Combined p-value of the meta-analysis for selected cohorts:
, which is estimated from single p-values,
Analysis in each individual cohort
Combined p-value of the meta-analysis for selected cohorts:
, which is estimated from single p-values,
Summary of the selected feature
Specific signature assessment
--Gene expression for single-cell
Specific signature assessment module provides a detailed view of one particular feature. The associations with immunotherapy response, overall survival (OS) and progression free survival (PFS) are investigated in the module.
Gene expression for single-cell: exploring the associations of gene expression abundances of single-cell level with immunotherapy response, OS and PFS.
Statistics
Number of selected cancer type:
Number of selected samples:
Number of selected cells:
Clinical Attribute
Gene Expression for Response Groups
tSNE Plot for Response Groups
Specific signature assessment
--Cell populations for single-cell
Specific signature assessment module provides a detailed view of one particular feature. The associations with immunotherapy response, overall survival (OS) and progression free survival (PFS) are investigated in the module.
Cell populations for single-cell: exploring the associations of cell population frequencies with immunotherapy response, OS and PFS. Cell populations were identified based on gene-cell matrix by R package, Seurat v3.0.1. We selected 1000 highly variable genes, sorted out top 10 principle components (PCs) based on 1000 genes, clustered cell populations, and visualized those populations in responders and non-responders by t-SNE.
Statistics
Number of selected cancer type:
Number of selected samples:
Number of selected cells:
Clinical Attribute
Response Groups
Difference of cluster
Highlight cluster
Overall Survival Kaplan-Meier Estimate
Progression-free Kaplan-Meier Estimate
Evaluation of Custom Feature
Pan-cancer
Signatures prioritization in pan-cancer analysis first aggregates samples into one dataset, then signatures are ranked based on the statistical significance of the associations in the aggregated dataset. It focuses on genomic features that are comparable across cohorts, including mutation, mutation signatures and immune cell components.
Statistics
Number of selected cancer type:
Number of selected samples:
Distribution of p-values for genes in pan-cancer
Distribution of p-values for mutational signatures in pan-cancer
Distribution of p-values for immune cells in pan-cancer
PLEASE NOTE, due to different experimental designs and data processing methods, and additional covariates, some bias might be introduced in the aggregated dataset.
Distribution of p-values for immune cells in pan-cancer
Specific signature assessment
--Mutation in aggretated dataset
Specific signature assessment module provides a detailed view of one particular feature. The associations with immunotherapy response, overall survival (OS) and progression free survival (PFS) are investigated in the module.
Mutations in aggregated dataset: exploring the associations of mutational frequencies with immunotherapy response, OS and PFS in the aggregated dataset.
Statistics
Number of selected cancer type:
Number of selected samples:
Clinical Attribute
Download
Data format:
Click row(s) in the table above to filter samples and
it, then click the 'GO' button on the left to re-analyze.
Query in TCGA data
Analysis in the aggregated dataset
Analysis in each individual cohort
Analysis in the aggregated dataset
Analysis in each individual cohort
Analysis in the aggregated dataset
Analysis in each individual cohort
Specific signature assessment
--Mutation loads/burden in aggregated dataset
Specific signature assessment module provides a detailed view of one particular feature. The associations with immunotherapy response, overall survival (OS) and progression free survival (PFS) are investigated in the module.
Mutations loads/burden in aggregated dataset: exploring the associations of mutational loads/burden (TMB) with immunotherapy response, OS and PFS in the aggregated cohort.
Statistics
Number of selected cancer type:
Number of selected samples:
Clinical Attribute
Download
Data format:
Click row(s) in the table above to filter samples and
it, then click the 'GO' button on the left to re-analyze.
Analysis in the aggregated dataset
PLEASE NOTE, due to different experimental designs and data processing methods, and additional covariates, some bias might be introduced in the aggregated dataset.
Analysis in each individual cohort
Analysis in the aggregated dataset
Analysis in each individual cohort
Analysis in the aggregated dataset
Analysis in each individual cohort
Specific signature assessment
--Mutational signatures in aggregated dataset
Specific signature assessment module provides a detailed view of one particular feature. The associations with immunotherapy response, overall survival (OS) and progression free survival (PFS) are investigated in the module.
Mutational signatures in aggregated dataset: exploring the associations of mutational signatures with immunotherapy response, OS and PFS in the aggregated cohort.
Statistics
Number of selected cancer type:
Number of selected samples:
Clinical Attribute
Download
Data format:
Click row(s) in the table above to filter samples and
it, then click the 'GO' button on the left to re-analyze.
Analysis in the aggregated dataset
Analysis in each individual cohort
Analysis in the aggregated dataset
Analysis in each individual cohort
Analysis in the aggregated dataset
Analysis in each individual cohort
Specific signature assessment
--Expression in aggregated dataset
Specific signature assessment module provides a detailed view of one particular feature. The associations with immunotherapy response, overall survival (OS) and progression free survival (PFS) are investigated in the module.
Expression in aggregated dataset: exploring the associations of gene expression with immunotherapy response, OS and PFS in the aggregated cohort.
Statistics
Number of selected cancer type:
Number of selected samples:
Pan-cancer analysis across selected cohorts
Statistics
Number of selected cancer type:
Number of selected samples:
Clinical Attribute
Download
Data format:
Click row(s) in the table above to filter samples and
it, then click the 'GO' button on the left to re-analyze.
Query in TCGA data
Analysis in the aggregated dataset
PLEASE NOTE, due to different experimental designs and data processing methods, and additional covariates, some bias might be introduced in the aggregated dataset.
Analysis in each individual cohort
Analysis in the aggregated dataset
Analysis in each individual cohort
Analysis in the aggregated dataset
Analysis in each individual cohort
Specific signature assessment
--Expression sum in aggregated dataset
Specific signature assessment module provides a detailed view of one particular feature. The associations with immunotherapy response, overall survival (OS) and progression free survival (PFS) are investigated in the module.
Expression sum in aggregated dataset: exploring the associations of sum gene set with immunotherapy response, OS and PFS in the aggregated cohort.
Statistics
Number of selected cancer type:
Number of selected samples:
Clinical Attribute
Download
Data format:
Click row(s) in the table above to filter samples and
it, then click the 'GO' button on the left to re-analyze.
Query in TCGA data
Analysis in the aggregated dataset
PLEASE NOTE, due to different experimental designs and data processing methods, and additional covariates, some bias might be introduced in the aggregated dataset.
Analysis in each individual cohort
Analysis in the aggregated dataset
Analysis in each individual cohort
Analysis in the aggregated dataset
Analysis in each individual cohort
Specific signature assessment
--Expression relation pairs in aggregated dataset
Specific signature assessment module provides a detailed view of one particular feature. The associations with immunotherapy response, overall survival (OS) and progression free survival (PFS) are investigated in the module.
Expression relation pairs: exploring the associations of gene pairs with immunotherapy response, OS and PFS. Gene expression relation pairs is a pairsmed score of relative comparison of gene pairs.
Statistics
Number of selected cancer type:
Number of selected samples:
Clinical Attribute
Download
Data format:
Click row(s) in the table above to filter samples and
it, then click the 'GO' button on the left to re-analyze.
Analysis in the aggregated dataset
PLEASE NOTE, due to different experimental designs and data processing methods, and additional covariates, some bias might be introduced in the aggregated dataset.
Analysis in each individual cohort
Analysis in the aggregated dataset
Analysis in each individual cohort
Analysis in the aggregated dataset
Analysis in each individual cohort
Specific signature assessment
--Immune cell components in aggregated dataset
Specific signature assessment module provides a detailed view of one particular feature. The associations with immunotherapy response, overall survival (OS) and progression free survival (PFS) are investigated in the module.
Immune cell components in aggregated dataset: exploring the associations of immune cell proportion with immunotherapy response, OS and PFS in the aggregated cohort.
Statistics
Number of selected cancer type:
Number of selected samples:
Pan-cancer analysis across selected cohorts
Statistics
Number of selected cancer type:
Number of selected samples:
Clinical Attribute
Download
Data format:
Click row(s) in the table above to filter samples and
it, then click the 'GO' button on the left to re-analyze.
Analysis in the aggregated dataset
Analysis in each individual cohort
Analysis in the aggregated dataset
Analysis in each individual cohort
Analysis in the aggregated dataset
Analysis in each individual cohort
Users' data
Clinical outcome data and at least one type of mutation data, transcriptomic data and single-cell data are required.
After uploading, mutation loads/burden will be counted from the mutation number. Mutational signature will be detected based on mutation data by the R package, deconstructSigs. Immune cell component would be calculated based on transcriptomic data first and then batch correction would be performed for pan-cancer analysis. For single-cell data, normalized single-cell expression profiles and the identification of cell population will be generated from gene-cell matrix.
Upload clinical data
Example file for clinical data: Example_clinical_data.txt
The clinical data should contain 12 columns which are 'Disease','PatientID','data_source','treatment type','treatment status','PFS.status','RECIST','OS.status','OS','PFS','Age' and 'Gender'.
Disease
: required. Cancer type.
PatientID
: required. A unique identifier for each sample.
data_source
: required. A character string specifying the experiment name (e.g. 'experiment_1', 'MyExperiment', 'User', etc).
treatment type
: required. A character string specifying the treatment type, for example, 'anti-PD-1', 'anti-CTLA-4', 'anti-IL17RA', etc.
treatment status
: required. Flaglist string specifying pre-treatment or on-treatment. Please insert one of 'Pre', 'On', or 'Unknown' for each sample.
PFS.status
: required. Flaglist string specifying the therapeutic outcome. Please insert one of 'response', 'nonresponse' or 'Unknown' for each sample.
RECIST
: optional. RECIST is a standard way to measure how well a cancer patient responds to treatment, please refer to NIH. Please specify one of 'CR', 'PR', 'PD', 'SD' or 'NA'.
OS.status
: optional. Specifying one of 'living', 'deceased' or 'NA'.
OS
: optional. A number specifying overall survival days. If no data available fill in NA.
PFS
: optional. A number specifying progression free survival days. If no data available fill in NA.
Age
: optional.
Gender
: optional. Specifying one of 'Male', 'Female' or 'NA'.
Please keep your column names same with above columns' names. If no data available please fill in NA.
Check for uploaded clinical data:
Upload transcriptome data
Example file for transcriptome data: Example_transcriptome_data.txt
The transcriptome data where each row represents a sample and each column represents a gene. And the gene expression values should be normalized and log2 transfered.
PLEASE NOTE: the 'PatientID' of each sample should match to the 'PatientID' column of clinical data.
Check for uploaded transcriptome data:
Upload mutation data
Example file for mutation data: Example_mutation_data.txt
The mutation data should contain 7 columns which are 'PatientID','gene','variant_class', 'Chromosome', 'pos', 'ref' and 'alt'.
PatientID
: required. Sample identifier. NOTE: the 'PatientID' column of mutation data should match to the 'PatientID' column of clinical data.
gene
: required. Gene symbols
variant_class
: required. Flaglist string specifying variant type. For example, 'Missense_Mutation', 'Nonsense_Mutation', 'Silent', 'Intron', and etc.
Chromosome
: required. Flaglist string or number specifying chromosome. For example, both of 'chr1','chr2' and '1', '2' are acceptable.
pos
: required. Mutation position. Default is set to the UCSC hg19 assembly, which corresponds to the GRCh37 assembly.
ref
: required. reference base.
alt
: required. alternate base.
Please keep your column names same with above columns' names. If no data available please fill in NA.
Check for uploaded mutation data:
Upload single-cell data
--Gene-cell matrix
Example file for gene-cell data: Example_gene_cell_data.txt
The gene-cell data where each row represents a cell and each column represents a gene. And the gene expression values should be read counts.
Check for uploaded gene-cell data:
--Patient-cell data
Example file for patient-cell data: Example_patient_cell_data.txt
The patient-cell data should contain 2 columns which are 'PatientID' and 'cells'.
PatientID
: required. Sample identifier. NOTE: the 'PatientID' column of mutation data should match to the 'PatientID' column of clinical data.
cells
: required. Cell names
Please keep your column names same with above columns' names. If no data available please fill in NA.
PLEASE NOTE: the 'PatientID' of each sample should match to the 'PatientID' column of clinical data. the 'cells' should match to the column names of gene-cell data.
Check for uploaded patient-cell data:
0
/
100
This may take a while
Methods
Cancer-Immu explores the associations of multi-angle features with immunotherapy response, which are derived from a variety types of genomic data, including genetic, transcriptomic and single cell. Genetic level is comprised of mutation, mutational loads/burden, and mutational signature. Transcriptomic level includes expression, expression sum, expression relation pairs and immune cell components. Single-cell level contains gene/protein expression and specific cell population (Figure 1).
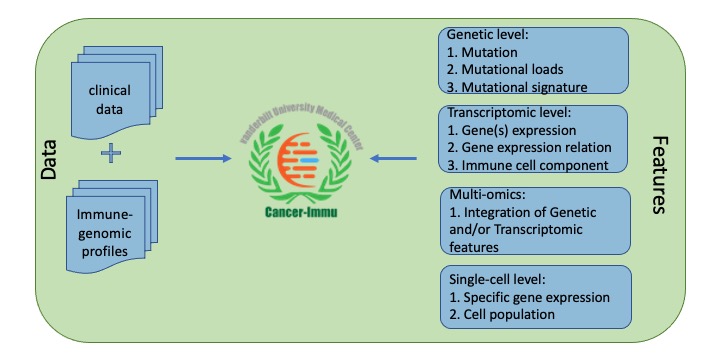
Figure 1. Data content of Cancer-Immu.
Cancer-Immu provides meta-analysis and pan-cancer analysis modules to detect consistent and rare omics features associated with immunotherapy response across multiple cohorts. Each analysis includes two functions, signature prioritization and specific signature assessment.
Signatures prioritization in the meta-analysis is aimed to rank signatures based on their common associations with immunotherapy response across multiple cohorts. The association test is performed in each individual cohort. Firstly, we scaled signature values in each individual cohort to z-scores with mean of zero and standard deviation of one. And then effect size and standard error of effect size were calculated from binomial logistic regression using z-scores as terms and immune checkpoint inhibitor therapy response as values. The meta-analysis results of the associations between signature and response (odds ratios) can be estimated by combining individual result in each study via meta-analysis by meta package in R. Then, as a final step, the signatures are ranked by the meta-analysis p-value/FDR (top panel of Figure 2). The detailed view of the association between one signature and ICB responsiveness, OS and PFS, is provided by specific signature assessment module (bottom panel of Figure 2).
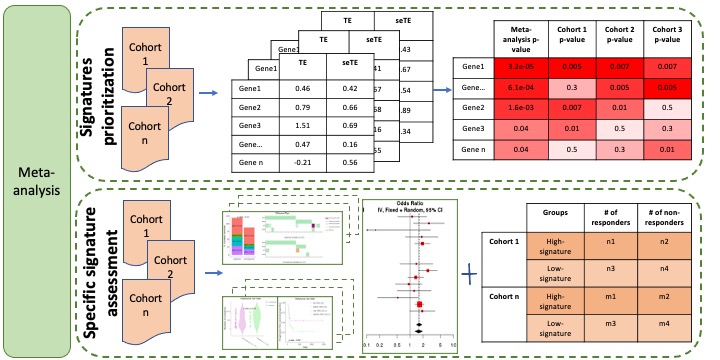
Figure 2. Meta-analysis module.
Pan-cancer analysis evaluates and ranks signatures based on their associations with ICB-based response in the aggregated cohort. To detect the associations between rare events and ICB-based response in a large-scale dataset rather than in multiple individual datasets, we aggregated datasets as one big dataset. Some genetic data, including mutation, mutation signatures and immune cell components, were integrated directly without any further process since genomic features are generally comparable and have negligible batch effects across datasets. For incomparable data, to remove platform- or laboratory-specific batch effects, we performed batch correction by using removeBatchEffect function of limma R package along with a design matrix to preserve the response effect. Signatures prioritization calculates the associations between signatures and ICB-based response and then ranks signatures based on the p-value in the aggregated cohort. Specific signature assessment provides a detailed view of the associations between one given signature and ICB therapeutic response, OS and PFS in the aggregated cohort (Figure 3).
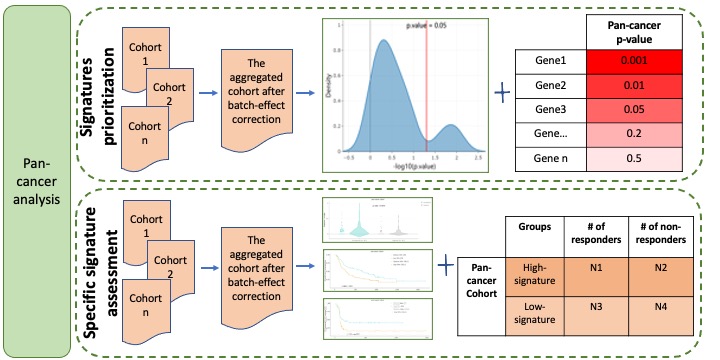
Figure 3. Pan-cancer analysis module.
Contact
If you have questions, comments, or find any bugs with Cancer-Immu, please contact
Dr. Qi Liu <
qi.liu@vumc.org
>
Dr. Jing Yang <
jing.yang@vumc.org
>
Reference
[ 1 ] Auslander N, Zhang G, Lee JS, Frederick DT, Miao B, Moll T, Tian T, Wei Z, Madan S, Sullivan RJ, Boland G, Flaherty K, Herlyn M, Ruppin E. Robust prediction of response to immune checkpoint blockade therapy in metastatic melanoma. Nat Med. 2018 Oct;24(10):1545-1549. doi: 10.1038/s41591-018-0157-9. Epub 2018 Aug 20. Erratum in: Nat Med. 2018 Dec;24(12):1942. PMID: 30127394; PMCID: PMC6693632.
[ 2 ] Chen PL, Roh W, Reuben A, Cooper ZA, Spencer CN, Prieto PA, Miller JP, Bassett RL, Gopalakrishnan V, Wani K, De Macedo MP, Austin-Breneman JL, Jiang H, Chang Q, Reddy SM, Chen WS, Tetzlaff MT, Broaddus RJ, Davies MA, Gershenwald JE, Haydu L, Lazar AJ, Patel SP, Hwu P, Hwu WJ, Diab A, Glitza IC, Woodman SE, Vence LM, Wistuba II, Amaria RN, Kwong LN, Prieto V, Davis RE, Ma W, Overwijk WW, Sharpe AH, Hu J, Futreal PA, Blando J, Sharma P, Allison JP, Chin L, Wargo JA. Analysis of Immune Signatures in Longitudinal Tumor Samples Yields Insight into Biomarkers of Response and Mechanisms of Resistance to Immune Checkpoint Blockade. Cancer Discov. 2016 Aug;6(8):827-37. doi: 10.1158/2159-8290.CD-15-1545. Epub 2016 Jun 14. PMID: 27301722; PMCID: PMC5082984.
[ 3 ] Hugo W, Zaretsky JM, Sun L, Song C, Moreno BH, Hu-Lieskovan S, Berent-Maoz B, Pang J, Chmielowski B, Cherry G, Seja E, Lomeli S, Kong X, Kelley MC, Sosman JA, Johnson DB, Ribas A, Lo RS. Genomic and Transcriptomic Features of Response to Anti-PD-1 Therapy in Metastatic Melanoma. Cell. 2016 Mar 24;165(1):35-44. doi: 10.1016/j.cell.2016.02.065. Epub 2016 Mar 17. Erratum in: Cell. 2017 Jan 26;168(3):542. PMID: 26997480; PMCID: PMC4808437.
[ 4 ] Prat A, Navarro A, PareL, Reguart N, Galvan P, Pascual T, Martinez A, Nuciforo P, Comerma L, Alos L, Pardo N, Cedres S, Fan C, Parker JS, Gaba L, Victoria I, Vinolas N, Vivancos A, Arance A, Felip E. Immune-Related Gene Expression Profiling After PD-1 Blockade in Non-Small Cell Lung Carcinoma, Head and Neck Squamous Cell Carcinoma, and Melanoma. Cancer Res. 2017 Jul 1;77(13):3540-3550. doi: 10.1158/0008-5472.CAN-16-3556. Epub 2017 May 9. PMID: 28487385.
[ 5 ] Riaz N, Havel JJ, Makarov V, Desrichard A, Urba WJ, Sims JS, Hodi FS, Martin-Algarra S, Mandal R, Sharfman WH, Bhatia S, Hwu WJ, Gajewski TF, Slingluff CL Jr, Chowell D, Kendall SM, Chang H, Shah R, Kuo F, Morris LGT, Sidhom JW, Schneck JP, Horak CE, Weinhold N, Chan TA. Tumor and Microenvironment Evolution during Immunotherapy with Nivolumab. Cell. 2017 Nov 2;171(4):934-949.e16. doi: 10.1016/j.cell.2017.09.028. Epub 2017 Oct 12. PMID: 29033130; PMCID: PMC5685550.
[ 6 ] Samstein RM, Lee CH, Shoushtari AN, Hellmann MD, Shen R, Janjigian YY, Barron DA, Zehir A, Jordan EJ, Omuro A, Kaley TJ, Kendall SM, Motzer RJ, Hakimi AA, Voss MH, Russo P, Rosenberg J, Iyer G, Bochner BH, Bajorin DF, Al-Ahmadie HA, Chaft JE, Rudin CM, Riely GJ, Baxi S, Ho AL, Wong RJ, Pfister DG, Wolchok JD, Barker CA, Gutin PH, Brennan CW, Tabar V, Mellinghoff IK, DeAngelis LM, Ariyan CE, Lee N, Tap WD, Gounder MM, D'Angelo SP, Saltz L, Stadler ZK, Scher HI, Baselga J, Razavi P, Klebanoff CA, Yaeger R, Segal NH, Ku GY, DeMatteo RP, Ladanyi M, Rizvi NA, Berger MF, Riaz N, Solit DB, Chan TA, Morris LGT. Tumor mutational load predicts survival after immunotherapy across multiple cancer types. Nat Genet. 2019 Feb;51(2):202-206. doi: 10.1038/s41588-018-0312-8. Epub 2019 Jan 14. PMID: 30643254; PMCID: PMC6365097.
[ 7 ] Snyder A, Makarov V, Merghoub T, Yuan J, Zaretsky JM, Desrichard A, Walsh LA, Postow MA, Wong P, Ho TS, Hollmann TJ, Bruggeman C, Kannan K, Li Y, Elipenahli C, Liu C, Harbison CT, Wang L, Ribas A, Wolchok JD, Chan TA. Genetic basis for clinical response to CTLA-4 blockade in melanoma. N Engl J Med. 2014 Dec 4;371(23):2189-2199. doi: 10.1056/NEJMoa1406498. Epub 2014 Nov 19. Erratum in: N Engl J Med. 2018 Nov 29;379(22):2185. PMID: 25409260; PMCID: PMC4315319.
...
Citation
Immuno-genomic atlas for immune checkpoint blockade-based cancer immunotherapy.
@Vanderbilt University Medical Center
Center for Quantitative Sciences
497A Preston Research Building | Nashville, TN 37232 | 615-322-6618